April 24, 2019
Machine learning in healthcare part 1
I started a series of projects to learn and show how artificial intelligence can be used to improve healthcare and help doctors to make stronger predictions, I will use public datasets available on the internet and if I can I will use private datasets as well.
Heart disease
In the first project we have to predict if a patient has a heart disease or not, you can download the dataset from Kaggle.
Here is the notebook with the code.
We have the following features:
-
Age
-
Sex
-
cp: Chest pain type.
-
trestbps: Resting blood pressure.
-
chol: Cholesterol.
-
fbs: Fasting blood sugar.
-
restecg: Resting electrocardiographic results.
-
thalach: Maximum heart rate achieved.
-
exang: Exercise induced angina.
-
oldpeak: ST depression induced by exercise relative to rest.
-
slope: The slope of the peak exercise.
-
ca: Number of major vessels.
-
thal: Duration of exercise test in minutes.
-
target: If the patient has a heart disease or not, the positive class is the patient has a heart disease and the negative class is the patient does not have a heart disease.
We can notice that a lot a features have weird names and weird descriptions, for someone who is not a doctor this could look quite confusing, however we can use our knowledge to understand the data.
Firstly we print the correlation matrix:
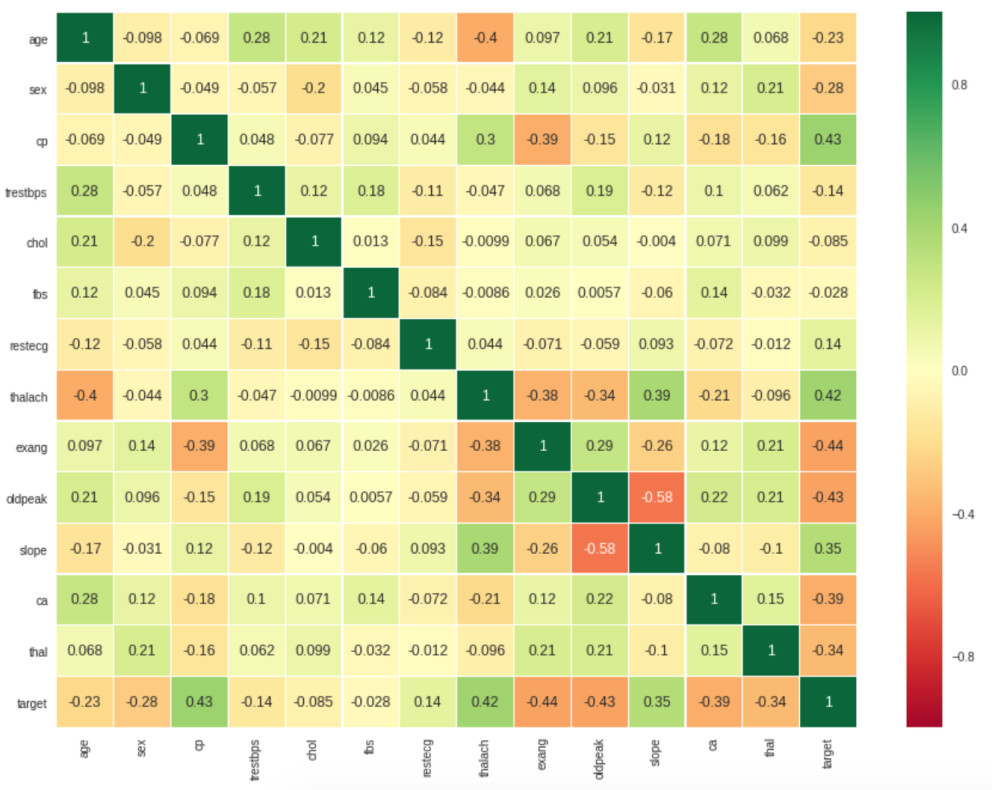
We can see that some features are correlated, target is positively correlated with the features slope, thalach, cp* and negatively correlated with the features exang, oldpeak, ca**.
Doing some research we can know that if a person has high levels of cholesterol there is a high probability for their blood vessels to be narrowed with more cholesterol which could cause lack of blood supply for the heart and furthermore a heart disease.
In this dataset the feature chol has a weak correlation with the column target this could indicate that the feature is not important to predict if the patient has a heart disease, another problem that could affect this is the lack of data, we only have 303 registers or 303 patients.
Since the dataset does not have null values the exploration will be easer to perform.
The 68% of the patients are men and the remaining 32% are women, 75% of the patients that are women have a heart disease and the 44% of the men patients have a heart disease.
138 patients does not have a heart disease (45%) and 165 have one (55%), the classes are almost balanced, when we split the dataset into training and validation sets we have to keep these percentages, in other words the training set will have 45% of negative classes (patients without a heart disease), 55% of positive classes (patients with a heart disease) and the validation set will have the same distribution as well.
I used three different models, Random Forest, Gradient Boosting and XGboost, Random Forest was the best, this model is an ensamble of several decision trees based on the Bagging technique which helps to avoid overfitting.
Random Forest obtained an accuracy of 85% in the validation set and 94% in the training set, in this type of problems is better to use different metrics like sensitivity and specificity, we can calculate these metrics with the confusion matrix:

sensitivity: If a patient has a heart disease how often the model predicts correctly this class.
If the model has a high sensitivity and the model predicts a negative class we can be sure that the patient does not have a heart disease.
sensitivity = True positives / (True positives + False negatives)
specificity: If a patient does not have a heart desease how often the model predicts correctly this class.
If the model has a high specificity and the model predicts a positive class we can be sure that the patient has a heart disease.
specificity = True Negatives / True negatives + False positives
The model obtained a sensitivity of 0.8 and a specificity of 0.9, it’s always good to have these two metrics balanced.
One more useful metric is the area under the ROC curve:

The best value for this metric is 1, this means that the model predicted everything correctly.
Diabetes
This project was harder than the first one due to the fact that the dataset is not good at all.
You can download the dataset from Kaggle.
Here is the notebook with the code
We have 768 patients or registers and 8 features:
-
Pregnancies
-
Glucose
-
BloodPressure
-
SkinThickness
-
Insulin
-
BMI: body mass index
-
DiabetesPedigreeFunction: Diabetes family historial
Age
The problem in this dataset are the registers with value of 0 that some features have, Glucose has 5 registers with value of 0, BloodPressure has 35 registers, BMI has 11 registers, we could delete these 51 registers without losing much information but the problem comes up when we see the Insulin feature that has 374 register with value of 0, these are almost the half of the total registers, we could try to change these values with the mean or median of the feature, however we would need some domain knowledge and ask some doctor if the new values are valid values.
One more problem are the unbalanced classes, we have 500 registers that belongs to the first class (patient without diabetes) and 268 registers that belongs to the second class (patient with diabetes).
Deleting the 51 bad registers and keeping the 374 registers we can achieve an accuracy of 79% in the validation set using a Random forest model with the default parameters, we achieve a sensitivity of 87% and a specificity of 64%, we can notice the big gap between the metrics due to the unbalanced classes, as you can see in the notebook I used Recursive Feature Elimination to remove useless features and try to improve the model but it did not work. Thankfully the Random forest model has a parameter that you can use if you have unbalanced classes. Therefore, the model will give more weight to the class with fewer registers to balance the training:
n_estimators=100, max_depth=5, class_weight='balanced'
With this model we can obtain an accuracy of 78%, a sensitivity of 79% and a specificity of 75%:

The ideal situation is having both metrics balanced, however there are situations where you care more about having fewer false positives or false negatives, therefore you will want to optimize the sensitivity or the specificity, even though you should be carefully, the model can achieve a sensitivity of 1 only predicting all the classes as positive, this behavior is more common if the classes are unbalanced.
To sum up, you should check several metrics and the confusion matrix to measure the performance of the model.